Annexes
Articles
Gaia Data Release 2 : Summary of the contents and survey properties, Gaia Collabaration
Gaia Data Release 2 : Mapping the Milky Way disc kinematics, Gaia Collabaration
Gaia Data Release 2: Using Gaia parallaxes, par Luri et al.
« Wrinkles in the Gaia data unveil a dynamically young and perturbed Milky Way disk », par Antoja et al.
Is the Milky Way still breathing? RAVE-Gaia streaming motions, par Carrillo et al.
The Radial Velocity Experiment (RAVE): Fifth Data Release, par Kunder et al.
The New Galaxy: Signatures of its Formation, par Freeman et al.
Autres cartes et images
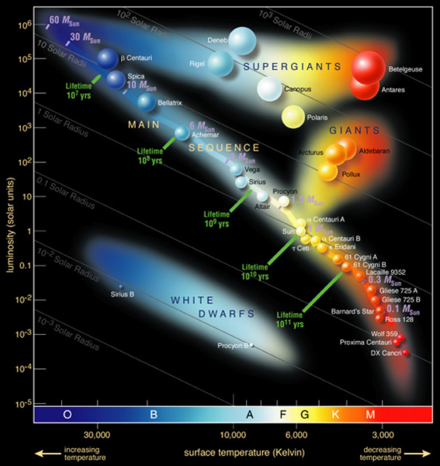
Le diagramme de Hertzsprung-Russell, montrant l'évolution des étoiles aux différents stades de leur vie.
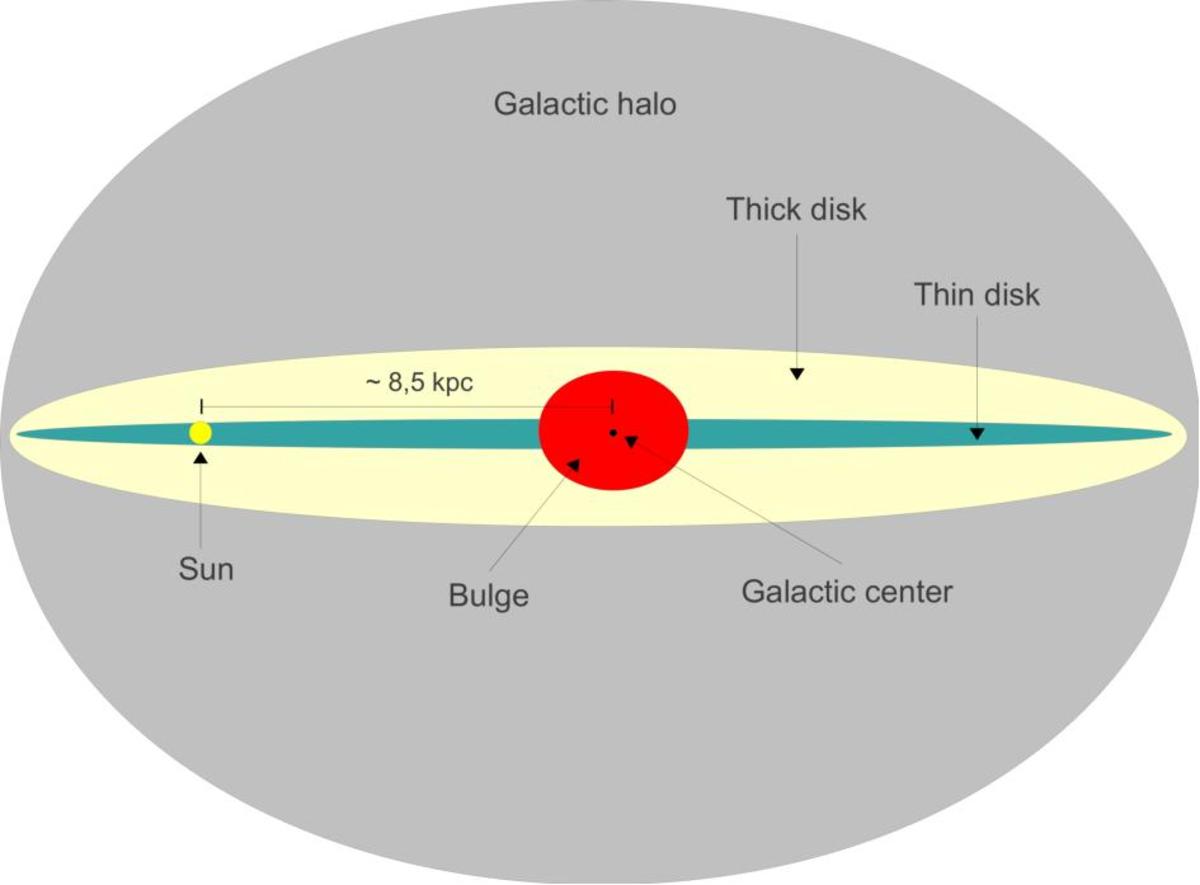
Géométrie de notre Galaxie.
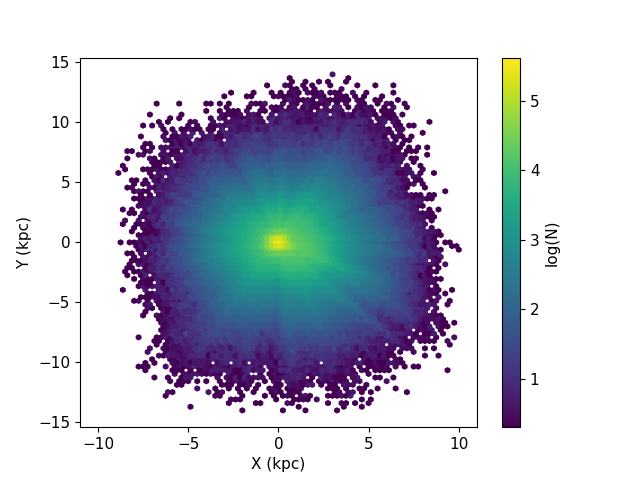
Vue "de haut" des données de Gaia.
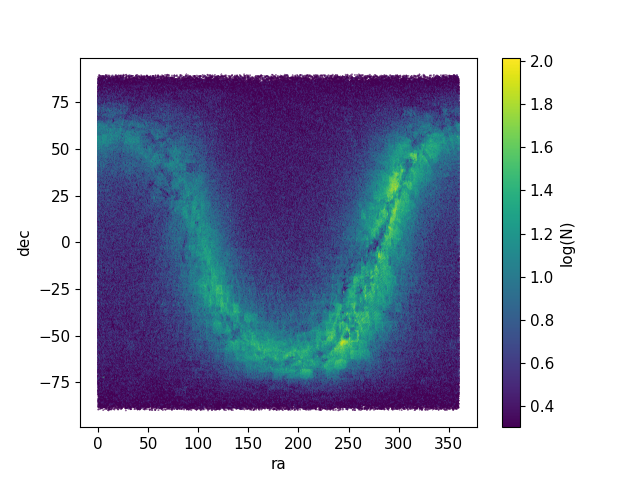
Vue en coordonnées équatoriales.
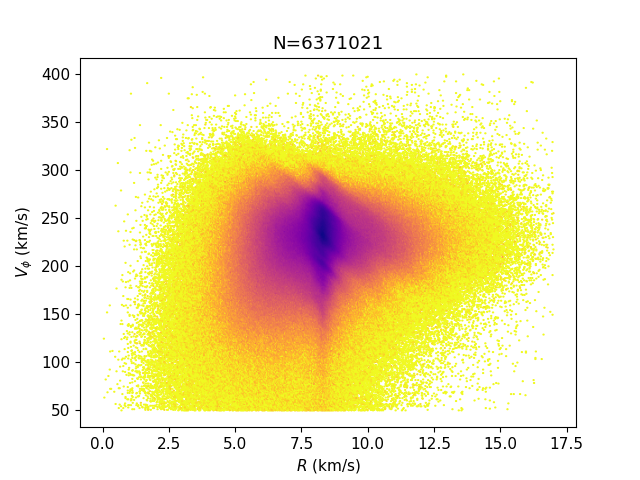
Vitesse radiale en fonction du rayon Galactocentrique.

Plan VR - VZ, où on peu apercevoir une forme de coquille (nouveau phénomène découvert par Gaia).
Code
Imports nécessaires
import scipy
import matplotlib as mpl
from scipy.io.idl import readsav
from matplotlib import pyplot as plt
from matplotlib  import cm
from numpy import random
from matplotlib.colors import LogNorm
from astropy.io import ascii
from astropy import units as u
from astroML.stats import binned_statistic_2d
import sys
import pandas as pd
import pickle
from matplotlib.backends.backend_pdf import PdfPages
import numpy as np
Paramètres et lecture du fichier
mpl.rcParams['image.cmap']='autumn'
mpl.rcParams['font.size'] = 11

input_file='GDR2_Antoja.h5'

read_input='y'
if read_input=='y':
    print('....')
    #data=pd.read_pickle(input_file)
    data=pd.read_hdf(input_file, key='table')
    print('input file read')
Exemple de carte (Z - VZ)
sel=np.where((abs(data.Z) < 1) & (abs(data.VZ) < 2000))[0]

plt.hexbin(data.Z[sel], data.VZ[sel], mincnt=1, gridsize=800, extent=[-1,1,-60,60], bins='log', cmap='plasma_r')
cb=plt.colorbar()
plt.xlabel('Z (kpc)')
plt.ylabel(r'$V_Z$ (km/s)')
cb.set_label('log(N)')
plt.title(r'(Z,$V_z$) C=log(N), N='+str(len(sel)))


plt.savefig('02.fig2a.png', format='png', dpi=600)
plt.close()